Industry Information
From NG Statistics to Process Fixes: Reading the Data
The inspection machine's NG log is not just a reject pile - how to read the per-family NG statistics, what they can and cannot tell you about causes, and the loop from sorting to process fix.
The Reject Pile Most Plants Never Read
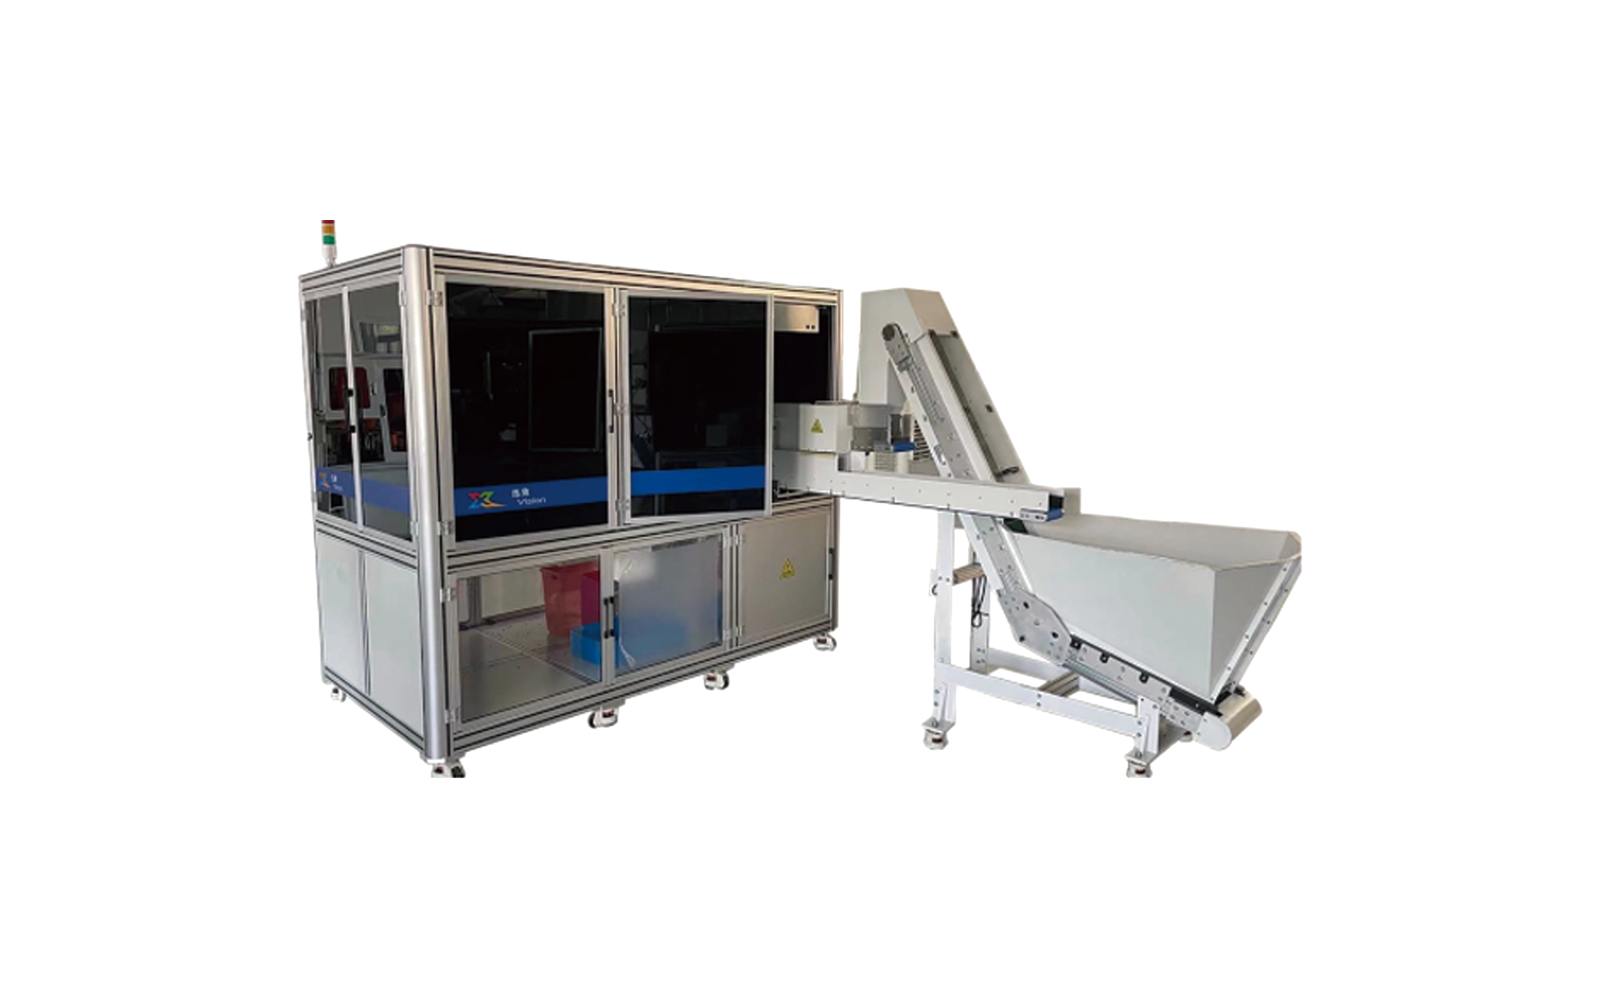
Every vision inspection machine produces a by-product most plants treat as waste: the statistics of what it rejected. Parts go to the NG bin, the shift moves on, and the numbers - which families, how many, trending which way - sit unread inside the machine's records. That is a missed instrument. The machine is not only a sorter: per the brochure, traceable, data-driven detection is listed on several models in the line, and the inspection software combines deep learning with traditional algorithms - so on a machine configured for full inspection (the mode the brochure lists for these models, and the full-inspection trade-off (/posts/sampling-plans-vs-full-inspection) is the backdrop), the NG statistics are a continuous process monitor you already own, built from every part presented rather than from samples. This article walks the reading loop: what the statistics can tell you, what they cannot, and how they connect to the cause-side analysis (/posts/rubber-molding-defects-glossary) that actually fixes the process. The records that make this possible are described in vision inspection data traceability (/posts/vision-inspection-data-traceability).
What the Statistics Can Tell You
Three readings, in increasing order of value:
• Family ranking (the defect Pareto): which defect families dominate your NG counts - flash versus short shots versus contamination - over a shift, a week, a month. The families are the brochure's inspection list; your ranking is which of them your process actually produces.
• Trend direction: a family that holds steady is a process in equilibrium; a family that starts climbing is a process drifting - mold wear opening the parting line, a compound change, a press setting that moved. The climb is usually visible in the statistics before a customer complaint would surface.
• Correlation anchors (event correlation): when a trend line crosses a real-world event - a new mold, a material batch change, a maintenance intervention - you get the strongest cause hypothesis available without a lab: the NG curve bends where the event happened.
What the Statistics Cannot Tell You
The statistics rank families; they do not name causes. "Flash count doubled since Tuesday" does not say whether the mold parting line wore, the press pressure moved, or the compound viscosity changed - that attribution is the cause-side work (/posts/rubber-molding-defects-glossary), and it happens at the press and the mold bench, not in the machine's data. Two more limits: the statistics only cover defect families the configuration checks - what the cameras cannot see produces no statistics at all, which is the purchase-boundary (/posts/when-not-to-buy-vision-inspection-machine) point again; and if operators clear or re-feed rejected parts by hand, the counts lie - the false-reject balance (/posts/false-rejects-false-accepts-inspection) has to be healthy first, or the trend lines measure operator patience instead of the process. One confounder to rule out before chasing causes: a configuration that has itself drifted makes the statistics measure the drift instead of the process - if a trend makes no process sense, check the configuration-drift signals (/posts/vision-inspection-configuration-drift) first.
The Loop from Sorting to Fix
The working loop has four steps, and only one of them happens at the machine:
1. Read: the weekly family ranking and trend lines - ten minutes, from the machine's records. 2. Attribute: take the climbing family to the cause glossary (/posts/rubber-molding-defects-glossary) and the press - which condition produces that family, and what changed on the line when the trend started. 3. Fix: the correction is a process action - mold maintenance, compound control, press setting - made by your process people, not by the inspection machine. 4. Verify: the same statistics confirm whether the fix worked - a climbing family that flattens after the intervention is the loop closing. No fix was ever verified by arguing; the curve is the referee.
Plants that run this loop treat the machine differently from plants that do not: it stops being an expense that sorts parts and becomes the feedback instrument that keeps the molding process honest between audits.
What Only the Sample Test Settles
The statistics loop depends on records. The sample test returns per-part evidence - images and the OK/NG decision log, not a summary sheet. On the machine, whether records are kept per part with images - rather than batch summaries - is one of the published configuration questions, and so are the export format, the integration with your quality system or SPC software, and whether trend alarms can be automated rather than watched by hand. Confirm these before ordering and on your parts at the sample test (/posts/vision-inspection-sample-test), because the loop above is only as good as the records feeding it.
Frequently Asked Questions
Can the NG statistics find the root cause for me?
No - they rank and track families, not causes. Attribution needs the cause-side analysis at the press and mold; the statistics tell you which thread to pull, not what is at the end of it.
How often should we read the statistics?
Weekly for the ranking, and a glance at the trend lines per shift is enough to catch a climb early. The value is in noticing the bend in the curve before a customer does - containment (/posts/re-screening-rejected-lot-containment) is what happens when you notice late.
Our NG counts are steady - does that mean the process is fine?
Steady means in equilibrium, not necessarily acceptable - a stable level of flash you have been rejecting for months is still a process producing flash. The ranking tells you what to negotiate with the press: fix it, or knowingly accept the cost.
Who should own the statistics reading?
Quality owns the reading; process and mold maintenance own the fixes. The loop breaks when quality reports the trend and nobody is assigned the attribution step - the curve keeps climbing while everyone agrees it is climbing.
Next Step
Take last week's NG breakdown from your current inspection setup - manual sorting tallies work too - rank the families, and pick the one climbing. Bring that family's defective parts and the trend to the sample test: the images and OK/NG decision log will show what a configuration catches on that family, and the statistics you keep will show whether your process fix bent the curve. Confidentiality for your trend data is confirmed when you first contact the team. Contact the team (/contact-us) - Monica (+86 138 5726 5705, WhatsApp) or Arya (+86 173 2430 9735), or email monica@aivisioncheck.com.